G Systems developed an automated measurement system using LabVIEW and National Instruments FieldPoint products to measure the concentration of a solution used in polishing integrated circuit (IC) connection points.
Develop a LabVIEW™ application for automatic determination of concentration of unknown solutions by measuring the optical transmission of light through the solution. Isolate the instrumentation and the test computer using FieldPoint™ modules. G Systems provided a solution using National Instruments FieldPoint modules with RS-232 serial interface and a custom-built rack to hold the spectrophotometer instrument and bottles containing the calibration standards.
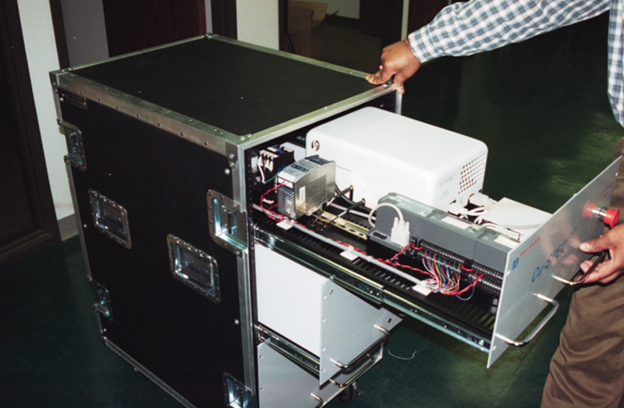
The system consists of a portable rack with three compartments. The top section holds the test instrumentation (spectrophotometer and FieldPoint modules), the middle section holds the pumping mechanism, and the bottom section holds the solution bottles, as shown in Figure 1. The system provides an input for a water source and an input from the chemical source. Communication to the FieldPoint modules and the spectrophotometer is achieved through an RS-232 serial interface.
The spectrophotometer is used to measure the absorbance of light at a user selected wavelength through the solution. The spectrophotometer has an input and output for fiber optic cables, which are positioned perpendicular to the sample solution passing through the flow cell. Light is transmitted through the liquid from the emitter end of the fiber optic cable and is detected by the detector end of the cable (see Figure 1). The absorbance of the liquid is calculated based on attenuation of the incident light.

This unit is designed to perform self-calibration automatically, verify the check standards, and determine the concentration of unknown solutions. The software controls the spectrophotometer, valve relays, and a pump through an RS-232 serial interface. The software displays the status of the relays and pump graphically and allows the operator to review the results history over a user-specified time interval.
The system is connected online to the source of the chemical whose concentration is to be monitored. The concentration is checked at regular intervals ensuring that the correct concentration is supplied to the process tool where the chemical is being used. The results history screen displays how the concentration changes over time.
The main LabVIEW application screen, shown in Figure 2, allows the operator to enter the test location and select whether the sample is online or offline. Through the test parameters screen, the user inputs the timing for opening the solenoid valves, the standards concentration, and the test limits.
The test begins by measuring the absorbance of water through the spectrophotometer to determine the baseline for subsequent intensity measurements. Next, the calibration curve between absorbance and concentration is determined by measuring the absorbance of five solutions with known concentrations. Then a calibration check is performed by measuring the absorbance of a check standard solution and determining its concentration from a calculated equation. When the calculated concentration lies within the range of the check standard concentration tolerance limits, the calibration check passes and the sample measurement is performed on the online solution. The solution’s concentration is measured and displayed on the screen.
The check standard measurement is always performed before the sample measurement to ensure that the system is calibrated correctly. The software checks the concentration at regular intervals set by the user. The operator can use the Snap Shot button to take a measurement while the software is waiting to make the next scheduled measurement. The main screen shows the progress of the test graphically and also displays a status description at the top of the screen.
HTML reports are generated automatically using LabVIEW 6i report functions. Through the report generation screen, the user can print or save the report. Other options include plotting the raw absorbance history for each standard, plotting the concentration of each solution over time, and viewing the calibration curves by specifying start and end dates. The user can check to see how often the calibration sequence is performed during a sample measurement and also can analyze the trend of the samples’ concentration variation over time.
Based near Dallas, Texas, G Systems is an internationally recognized systems integrator specializing in the modernization of complex systems of all sizes. We are experienced in the design, integration, assembly, production, and maintenance of custom turnkey solutions that support our customers at all phases of their product’s maturity cycle.
NAICS Codes: 541330, 541715, 541511, 334515, 335999, 334519
CAGE Code: 3HPP5