Develop a modular application in LabVIEW and LabVIEW RT (Real Time) where the data acquisition system is distributed among a host PC, FieldPoint controllers, and Compact Vision Systems.
Introduction
At the Wind Science and Engineering Research Center at Texas Tech University in Lubbock, Texas, full-scale test platforms have been constructed to study the effects of wind loading on the structural performance of a 200 meter tall tower, traffic signal lights with different boom lengths, and a one-story building. Although the tests are run independently, the ability to acquire data from all three simultaneously in a synchronous manner allows correlation of data between the experiments. The three test set-ups are described below.
Tower Measurement
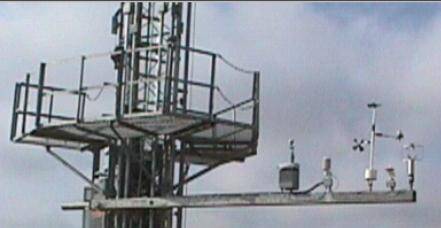
Four groups of National Instruments FieldPoint FP-2000 controllers with up to four analog input modules each were mounted on the 200 meter tower to acquire data from sensors mounted at ten different levels on the tower (see Figure 1). These sensors are used to obtain profiles for wind velocity, temperature, barometric pressure, relative humidity, and particle concentration.

Figure 1: Tower Sensor Assembly
Signal Light Structure Measurement
Each traffic light structure was configured with a FieldPoint controller and National Instruments Compact Vision System CVS-1454. The FieldPoint module on the signal light structure was used to track wind velocity, temperature, barometric pressure, and strain. The Compact Vision System (CVS) unit mounted on the base of the signal light structure was used to measure the displacement and rotation of the signal light by tracking an infrared light target mounted at the end of the boom arm. Using an infrared sensitive target and an infrared filter on the camera allowed reliable data acquisition continuously, both day and night.
Building Measurement
Seven FieldPoint controllers were distributed inside a building to acquire data from wind speed sensors, pressure sensors, LVDT displacement sensors, and load sensors. In addition, the FieldPoint units contain digital output modules to control solenoids used for calibration of the pressure sensors and cleaning of the pressure sensor ports.
Designing a modular, expandable, and configurable system
The software consists of two main components: 1. real-time (RT) programs that run on each of the FieldPoint (FP) and Compact Vision System (CVS) controllers and 2. a Windows program that runs on a desktop computer as illustrated in Figure 2. Both the RT programs that run on the FP and CVS units have a similar architecture.
Figure 2: System Overview Diagram
The RT programs consist of a high priority Data Acquisition module that reads the analog signals and visual information at a deterministic period of 33 ms and send it to the host program via TCP/IP using a lower priority Data Pump module.
For the CVS, the Image Analysis module processes the images at 60 frames per second (fps) and provides the results to the host computer every 33 ms. In this mode, only the process data are sent. However, in the diagnostics mode, the CVS RT program can send compressed images back to the host computer at a non-deterministic rate.
One experiment required control of solenoids for calibration and cleaning of pressure ports. This was easily accomplished by adding digital modules to the FP bank. The RT code automatically determines if a digital output bank is present and activates the outputs on commands from the host computer.
On the host side, configuration information is used to dynamically launch the complementary software modules for each of the FP and CVS controllers. These modules are launched from VI templates and are the Data Sink modules that receive data from the Data Pump modules; the Control modules that send commands to the RT Control modules; and the Diagnostics modules that receive diagnostics messages from the RT Diagnostics modules.
To record a run, the run number is sent simultaneously to all the RT control modules using Timed Loops so that the data received would be synchronized to one sampling period. Once the data received mirrors the run number sent, the Data Sink modules begin logging the data to files. G Systems developed a re-usable ActiveX component that provides data management using tags and collections called Tag Manager. It allows the user to see all messages (including error messages) in chronological order, even while data are being logged, which is very helpful for troubleshooting.
Monitoring and logging data from the different test platforms
Two RT programs were developed, one for the FP units and one for the CVS units. This commonality of code for the different experiments allows for easy expandability of the systems by simply adding additional FP or CVS units. The system setup was also simplified and consolidated. FP units can be assigned to any of the test platforms and specific channel information such as channel name, scaling, and units can be configured as illustrated in Figure 3.
Figure 3: Channel Configuration User Interface (GUI)
The CVS units are also able to perform a user-controlled calibration to allow for changes in configuration of the equipment such as camera zoom settings.
Various custom screens allow tasks ranging from controlling/viewing solenoid states and updating image calibration factors to viewing data specific to a test platform such as velocities at each level of the tower or a wire-frame diagram for the infrared light sources for the signal lights. The user can also view the collections of channels for a FP or CVS module by selecting the test platform, group, and hardware type. Furthermore, the user has the flexibility to view user-configurable groups of channels as shown in Figure 4.
Figure 4: User Defined Graphs and Signal Light Wireframe Conclusion